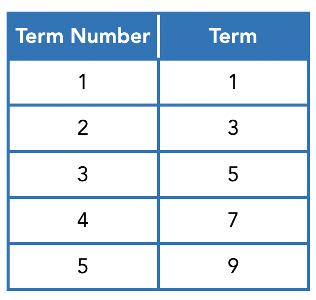
Building upon an understanding of linear relations in which students describe and represent linear patterns as a relation or function, students explore linear relations that may include negative integers. For example, consider the pattern 1, 3, 5, 7, … (At first glance this pattern does not contain negative integers, but they are still involved as will be seen). Using the language of term and term number, the 4th term is 7.
To identify the pattern rule algebraically, it helps to begin with representing the pattern as a table of values. The goal is to figure out how to relate each term to its term number.
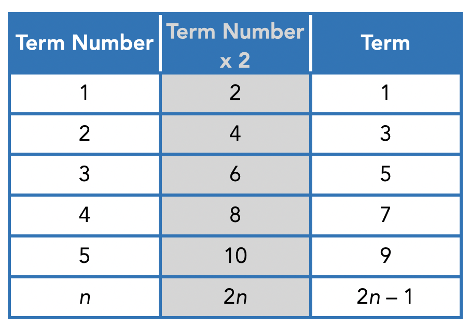
Noticing that the term goes up by 2 each time, repeated addition with 2 is connected to multiplying by 2. If we multiply the term number by 2, we always end up with a number that is one more than the term. So to get each term, we need to multiply the term number by 2, then subtract 1. Algebraically, we can represent this rule using the expression 2n – 1.
Students can create an input/output table, and extend it to negative integers. They can also graph this relation.
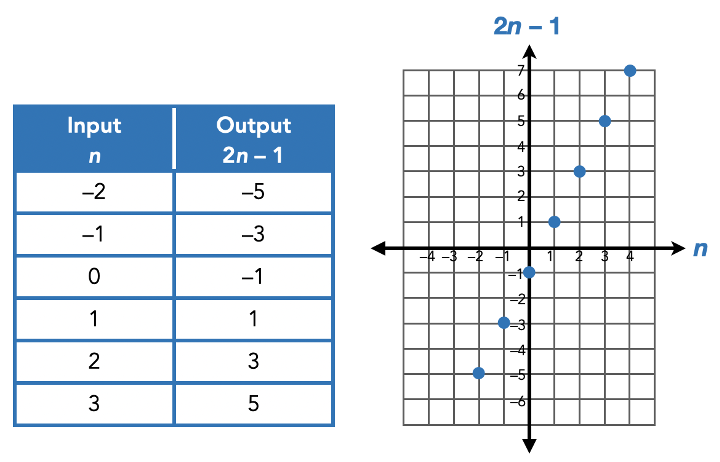
It is important that students understand the important connections between these different representations. In the expression 2n – 1, the 2 is called the numerical coefficient, but more importantly represents the rate of change, i.e., how the pattern changes as it progresses from one number to the next. The –1 is called the constant, because it is the constant value that adjusts the value of each term. The rate of change and constant show up in all representations, in related ways.
| Table of Values | Graph |
2n (rate of change) | The output goes up by 2 as the input increases by 1. | The points go up 2 for every 1 space they go right. |
– 1 (constant) | The output is –1 when the input is 0. | The graph crosses the vertical axis at –1. |
A visual pattern is a powerful way to develop and make sense of these concepts, as will be illustrated in the Week at a Glance.
Students will also apply these concepts and their representations to decreasing patterns, as well as to contexts involving linear relations.
Focus: Extending increasing linear relations using a visual pattern and table of values
Before:
- Do a Same But Different routine to explore an increasing vs a decreasing linear pattern. For example:
- 3, 7, 11, 15, …
- 48, 44, 40, 36, …
- How are they the same? [e.g., they both change by 4]
- How are they different? [e.g., one is increasing and the other is decreasing]
- Is there a number that will be in both patterns? [e.g., no, because one only has odd numbers and the other only has even numbers]
During:
- Present an increasing linear visual pattern such as:

- Students may work in pairs or small groups.
- Using pattern blocks (or the polygon tools from Polypad), ask students to build the next two figures. Discuss how the pattern is growing.
- As a class, create a table of values of the total number of hexagons in each of Figures 1 to 5. Ask the class what they notice.

- Ask the class if they can figure out how many hexagons would be in Figure 20.
- Circulate among the groups and observe the different strategies. Prompt for thinking with questions such as, “How do you know?”, “Is there another strategy you could try?”, etc.
After:
- Ask how many hexagons are in Figure 20. [58]
- Have some groups share their strategy for determining how many hexagons are in Figure 20, ideally in a sequence that progresses. For example:
- We built each figure by adding on 3 hexagons each time. When we got to Figure 20 we needed 58 hexagons.
- We extended the table by adding 3 each time to get 58.
- To go from Figure 5 to Figure 20 we would need to add 3 hexagons 15 more times, which is 45 more hexagons. 13 + 45 = 58.
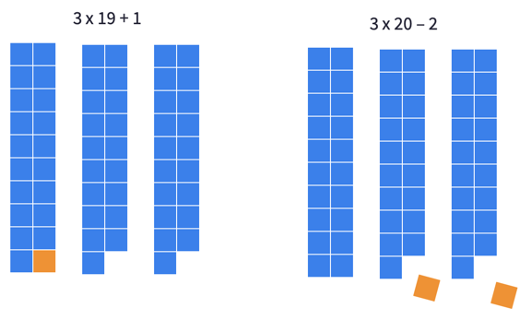
- There’s the one hexagon in the center, and then 3 branches of hexagons which are one less than the figure number. So 3 x 19 + 1 = 57 + 1 = 58
- If we do 3 times the figure number for each branch, we need to subtract 2 hexagons because we count the center hexagon 2 extra times. 3 x 20 – 2 = 58
- As each strategy is shared, ask the class how this strategy connects to the earlier strategies. Note especially the transition from extending the pattern one figure at a time to using more efficient strategies that jump to Fig. 20.
- Ask the class to use one of the strategies to determine the number of hexagons in a figure way down the line. They can choose which figure.
- Have the class work on one or more other such visual patterns (increasing linear patterns), or some groups may wish to create their own.
- Explain that next class they will work on figuring out an algebraic expression for such patterns.
Focus: Representing linear relations with an expression using the visual pattern and table.
Before:
- Show the first 3 figures from the visual pattern from yesterday.
- Write down the following 2 expressions to describe two of the strategies for Figure 20 from yesterday:
- 3 x 19 + 1 = 58
- 3 x 20 – 2 = 58
- Have a class discussion with questions such as:
- How does each equation represent how many hexagons are in Figure 20?
- How can you show that both expressions are equivalent?
- Either visually or numerically, one can see that with both expressions, you end up with one group of 20 and two groups of 19.
- In the visual pattern, this makes sense because we can see visualize one branch of the figure number, and two branches that are one less than the figure number.
- Point out to the class that they will be focusing today on expressions like the second one because it relates to the figure number directly.
During:
- Have the class work in pairs or small groups.
- Provide a different visual pattern (an example is below) for them to explore. Alternatively you may wish to provide more than one and ask them to choose. The patterns could be of different complexities.
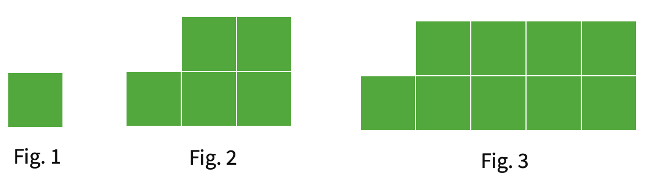
- Ask them to make a table of values.
- Ask them to explore how many squares would be in Figure 50, encouraging them to think both visually (how to visualize what Fig. 50 looks like) and numerically (how they could jump down the table of values).
- Circulate among the groups and observe the different strategies. Prompt for thinking with questions such as, “How do you know?”, “Where do you see the figure number in each figure?”, etc.
After:
- Ask how many squares are in Figure 50. [197]
- Ask how does the pattern grow. [4 squares are added each time]
- Write out a table of values, but insert a column for multiplying the figure number by 4 to represent the repeated addition of 4. Leave room for a row before Figure 1.
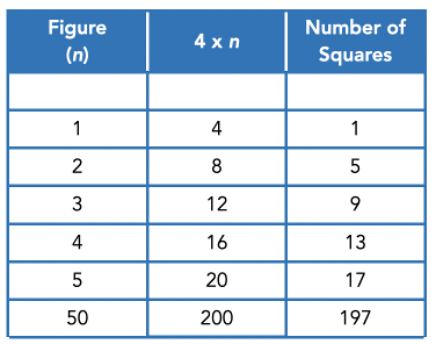
- Ask how the third column compares to the second column. [the third column numbers are 3 less than the second column numbers]
- Add a row and write the figure number as Ask how they could generalize this pattern using an expression.
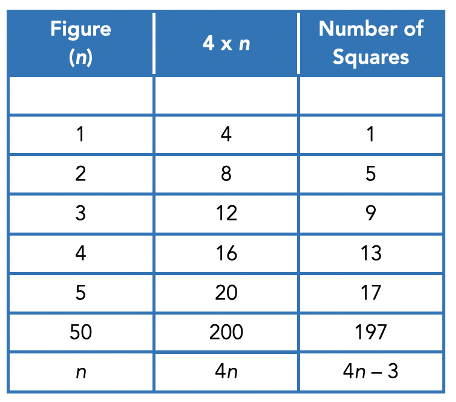
- Ask them to test the expression with other figure numbers. For example, 4 x 5 = 20 – 3 = 17
- Ask them what if we extended the pattern backwards. How many squares would be in Figure 0? Record in the table.
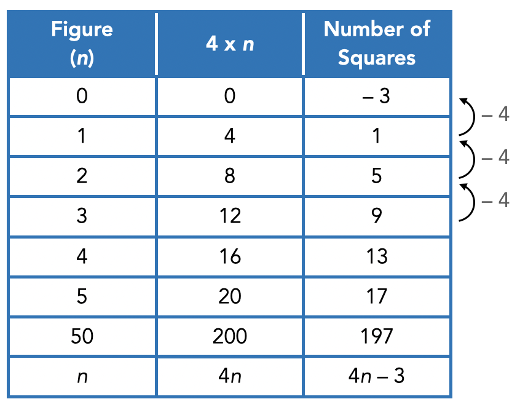
- Ask them what they notice about the number for Figure 0. [It’s the same as the number they put after the 4n.]
- Ask them if there is a way to see this –3 in the visual pattern? [If we add in 3 ‘negative’ squares to each figure, we can see that the figure number says how many groups of 4 squares there are.
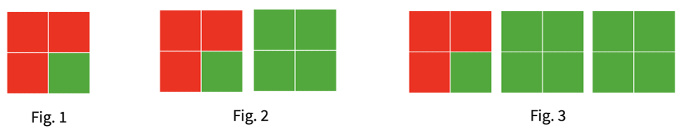
- Explain that the –3 is called the constant of the expression, because its value does not change but is the same for each figure. The 4 in 4n is called the rate of change because it describes how the pattern is growing.
- Have the class work on one or more other such visual patterns (increasing linear patterns), or to try numerical patterns such as 2, 7, 12, … For each one, ask them to determine an expression that generalizes the pattern, and to identify the rate of change and the constant.
Focus: Graphing linear relations, and making connections between representations
Before:
- Display a coordinate grid but just show the first quadrant.
- Write down positive coordinates such as (4, 3). Ask the class where they would plot the point on the grid. You may also use a deck of cards to get random numbers, but just use the black cards at first.
- Repeat the process for another point or two.
- Next write down (–4, 3) and ask them how they think we would be able to plot this point? [The x-value is now negative so we can extend the number line to the left]
- Extend the grid to the left and plot the point.
- Next write down (3, –4) and ask them how we could plot this point. [We can extend the y-axis numberline down].
- Plot this point, and then ask about and then plot the point (–4, –3).
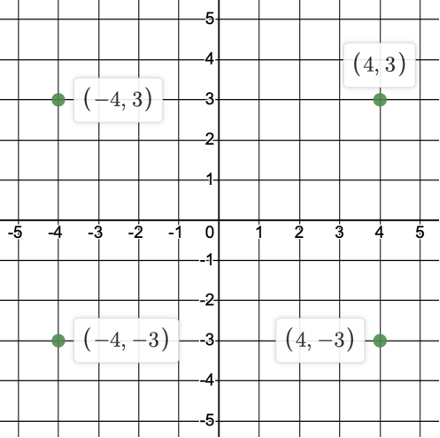
- Record the points into a table of values.
- Provide students with grid paper and a deck of cards. Have them work in pairs to practice plotting points in 4 quadrants by randomly drawing two cards for each point. The red cards can represent negative integers. Ask them to record their points in a table of values as well.
During:
- Provide a visual pattern (either a new one or you could use one from earlier in the week). This one below is adapted from Fawn Nguyen (Visual Pattern #75)

- Have students work in groups.
- Ask them to create a table of values, and then to graph the table of values.
- Ask them to figure out how many dots would be in Figure 10, and how they could make sense of this number:
- Visually using the visual pattern
- Numerically using the table of values
- Graphically by extending their graph
- Algebraically by using an expression
After:
- Have the class share how each representation can be used as a strategy for figuring out how many dots would be in Figure 10.
- Visual Pattern:
- There are 9 rows of 4 dots, plus the row of 3 dots on the top, for a total of 39 dots.
- There are 10 groups of 4, but the top group is missing one, so 10 x 4 – 1 = 39
- Table of Values: Each row goes up by 4 each time. Figure 3 has 11 dots, and in 7 more rows will add 28 more dots for a total of 39.
- Graphically: To plot each next point we go one over and 4 up.
- Visual Pattern:
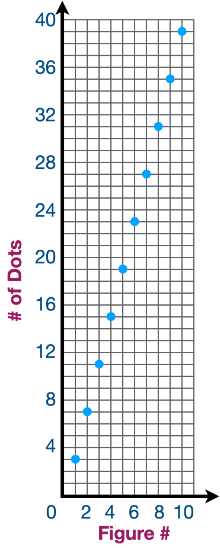
- Expression: We reasoned that the expression was 4n – 1. So for figure 10, 4 x 10 – 1 = 39
- Discuss what was similar or different between the strategies, and which one they prefer for determining the answer. Using the expression is probably the simplest, but to figure out the expression you need to use another one of the representations.
- As an exit ticket, ask the students to describe where they see the rate of change (4) and constant (–1) in each representation.
Focus: Extending linear relations in both directions
Before:
- Write down 2 increasing patterns. For example:
- 1, 3, 5,…
- 2, 5, 8, …
- Say to the class, “Both patterns have the number 5. What other numbers are in both patterns?”
- Give students time to explore in pairs.
- Share what they found out. [The numbers they have in common are 5, 11, 17, 23, …]
- Ask why they think a common number happens every time they go up by 6? [The first pattern increases by 2 and the second pattern increases by 3, and the LCM of 2 and 3 is 6.]
- What if we extended each pattern to the left? [5 was common, so we can go backwards by 6 each time to get –1, –7, –12, …]
During:
- Have the students work in pairs or small groups.
- Present this problem to the class: A pattern has the numbers 2 and 8 in it. What could the pattern be?
- Explain to the class that this is an open question, so there are many possible correct answers. They may use any representation they find helpful.
- Ask them to determine an expression for each pattern they find.
After:
- Have the class share their patterns and their strategies. Some may use a graph or a table. Below is a strategy using patterns written as sequences:
- We realized we could go from 2 to 8 by increasing by 1, 2, or 3 or 6. So our patterns were:
- 2, 3, 4, 5, 6, 7, 8, 9, … n + 1
- 2, 4, 6, 8, 10, … 2n
- 2, 5, 8, 11, … 3n – 1
- 2, 8, 14, … 6n – 4
- Consider the pattern that increases by 3. It could have different starting numbers:
- 2, 5, 8, 11, …
- –1, 2, 5, 8, …
- –4, –1, 2, 5, 8, …
- –7, –4, –1, 2, 5, 8, …
- Ask students to determine an expression for each pattern. What do they notice?
- We realized we could go from 2 to 8 by increasing by 1, 2, or 3 or 6. So our patterns were:
Focus: Practice exploring and representing increasing linear relations, including connecting representations
Before:
- Show students 4 graphs and 4 expressions. For example:
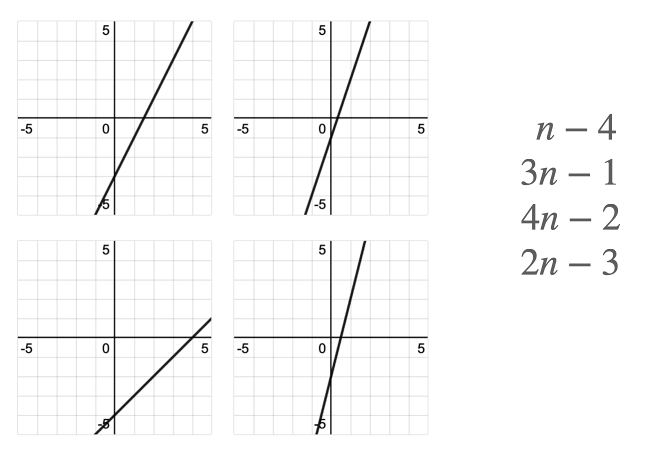
- Have a class discussion about which expression goes with each graph, and how do they know. Some may suggest using the rate of change and others may suggest using the constant.
During:
- Create a set of cards of four or five linear relations with several representations of each, which could include:
- Expression
- Table of Values
- Graph
- Visual Pattern
- Have students work in groups. Give each group a set of the cards.
- Ask the students to sort the cards into different linear relations by matching representations.
- When done, a group can share and compare their sets with another group.
After:
- Have a discussion about what strategies they used to match the representations. Were there representations that they chose to match up first? For example:
- We started by matching tables of values with graphs because we could easily see the coordinates in the table.
- We looked at the rate of change first and matched representations that had the same rate of change.
- Groups could then create their own card set and share it with another group.
As students have been developing their algebraic thinking to solve equations over the years, they have developed several different strategies. In Grade 7, these strategies are applied to what the curriculum calls “two-step” equations with whole number coefficients, constants, and solutions. Rather than “two-step”, what more defines the Grade 7 level of equation is that the equation has two operations. So instead of solving an equation like 3x = 9, they’ll solve an equation such as 3x + 2 = 11.
Students will more naturally think algebraically when a problem is situated in a context rather than using symbols. For example, “23 students were put into 6 groups. 5 of the groups had the same number of students, and the sixth group had 3 students. How many students were in each of the 5 groups.” Rather than trying to translate this problem into an equation, students can act it out or use concrete materials, or even just think about the situation, to identify that there would be 4 students in each of those groups.
Returning to the equation 3x + 2 = 11, here are a variety of strategies. Notice how the algebraic thinking is very similar across each strategy, so these are more about different representations of that thinking.
- Concretely (counters): I have 11 counters. I put 2 aside and put the remaining 9 counters evenly into 3 groups. So I have to put 3 counters in each group.
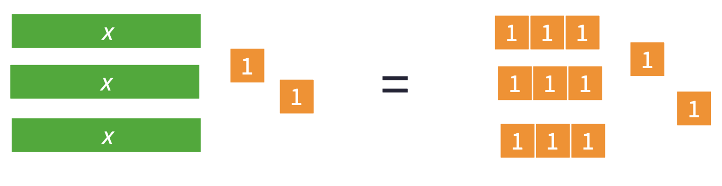
- Concretely (algebra tiles – note that Polypad has virtual algebra tiles which can also be used with a balance):
- Pictorially (bar diagram):

- Pictorially (number line): This is essentially the same as the bar diagram, but simpler to draw. It begins with:

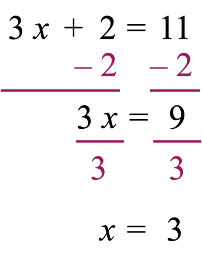
- Symbolically (inspection): I know that 9 + 2 = 11 so 3x must equal 9. So x = 3.
- Symbolically (preservation of equality):
While students are expected to be able to solve these two-step types of equations symbolically using preservation of equality (perform same operation on both sides to isolate the variable while preserving equality), it is very important that they make sense of this process rather than follow procedural steps that were told to them. Such sense-making arises out of representing symbolically a sense-making process such as algebra tiles.
Taken literally, the curriculum seems to limit this type of equation to ax + b = c, where a, b, and c are whole numbers, and the solution x is also a whole number. A reasonable interpretation of the curriculum would also include ax – b = c because b can still be looked at as a whole number which in this case is subtracted. One could also justify exploring the forms
and because these cases also involve whole numbers with.
Focus: Using contextual problems to make sense of two-step equations
Before:
- Have students explore single-operation contextual problems taking place in a dollar store (assuming whole number prices only). For example (choose “items” that are interesting for your students):
- 2 different items cost a total of $14. If one item costs $6, how much does the other item cost?
- 4 items cost $8. How much does one item cost?
- After a $6 item was put back on the shelf, the total was now $18. What would the total have been before the $6 item was returned?
- What was the total cost of 3 items that cost $4 each?
- Have students share their ideas about which operation made sense for each scenario. Because of how the operations are related, the same scenario may be looked at as involving addition or subtraction. Similarly, the same scenario may be looked at as involving multiplication or division.
During:
- Have students work in pairs or small groups.
- Tell students they may use whatever approach that makes sense to them to solve the problem, include concrete materials, pictures, or symbolically.
- Present a problem such as: “At a dollar store, a sports drink costs $3. Jose bought one sports drink and 4 nutrition bars. His total before taxes was $11. How much does one nutrition bar cost?”
- For groups that finish before others, you could give them further things to do such as:
- Is there a different strategy or representation you could use?
- Write a similar problem using items that you choose, and give it to another group to solve.
After:
- Have some groups share how they solved the problem. Ideally select them in order of complexity. For example:
- We used 11 counters. 3 of them were the sports drink so that left 8 counters. We put those 8 counters into 4 groups to represent the nutrition bars, so each bar cost $2.

- We subtracted $3 from $11 to get $8. We then divided the $8 by 4 to get $2 each.
- Discuss how the different approaches all used similar thinking, and we call this algebraic thinking. In this case it made sense first to subtract 3, then to divide by 4.
- Even though they will formalize an algebraic approach before the end of the week, it is helpful to represent their approaches symbolically even at this stage.

- As a closing task, you could set up something like this problem but with larger numbers. Put 11 counters into each of 3 bags. Put 12 counters scattered outside the bags. Tell the class that you have 45 counters. You put the same number of counters into each bag, and there are 12 counters left over. How many did you put into each bag?
Focus: Solving equations concretely/pictorially using algebra tiles
Before:
- Splat! Is a powerful routine connecting number sense and algebraic thinking. Do one or two Splat! activities. Choose from the Multiple Splat sets. For example:

- Have students explain their thinking for how they know how many dots are under each splat.
During:
- This learning experience uses algebra tiles. Though these may be new to many of your students, they are no different from any of their other concrete explorations in which they used some object to represent an unknown value. Students will use the x-tiles to represent the variable, and the units tiles to represent the numbers.
- This activity uses algebra tiles and a balance from Polypad. Alternatively, you could use concrete algebra tiles. You could spread this over two days if you wanted one day just to explore using algebra tiles before using the balance on the second day.
- Have students work individually, or in pairs. After each prompt below, monitor students progress to make sure they are modelling the situation correctly. You may wish to do a quick demo before hand so that they see how the balance scale tool works.
- Under the Algebra menu, bring in a balance scale.
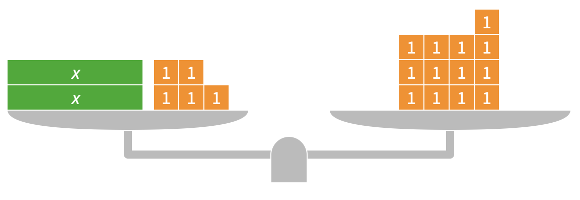
- On the left side of the balance, model 2x + 5 using algebra tiles
- Build 13 on the right side using unit tiles.
- Balance the scale by clicking on the fulcrum (centre part) and clicking on Balance.
- Tell students to remove one of the unit tiles from one side. What do they notice? How could they restore the balance? [They could put the unit tile back, but the idea intended here is to remove a unit tile from the other side.]
- Tell students to continue manipulating the tiles in order to figure out what the value of the x-tile is while keeping the scale balanced.
- Once the solution makes sense to them, they could try some other equations.
After:
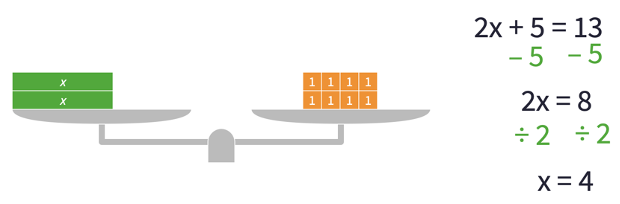
- Show the equation modelled using Polypad on a balance scale. Ask students to guide you through the process of solving the equation. As you do each step, represent the process algebraically.
- Remove five tiles from each side.
- Put the right side into two groups
- Each x-tile balances with 4 unit tiles, so x = 4
- Explain to the class that this process is called isolating the variable.
- Give students a choice of some other equations to model and solve using the algebra tiles and balance scale.
- As an exit ticket or journal prompt, ask students to compare the process they used today with how they solved an equation like this before today. What is similar? What is different?
Focus: Formalizing preservation of equality using inverse operations as a strategy to solve two-step equations
Before:
- Present the equation:

- Have the class share what number goes in the box and how they know.
- Write 2n inside the square.

- Do a think-pair-share on how changing the unknown to 2n affects the solving process.
- We had to do an extra step. We know the box equals 10, but there are two n’s so each n must equal 5.
- Explain to the class that what they have experienced with solving these types of equations is that it makes sense to isolate the term with the variable first.
During:
- Have students work in pairs or small groups.
- Provide a few equations for them to solve (of the form ax + b = c). Use different letters for each equation to indicate that a variable can use any letter.
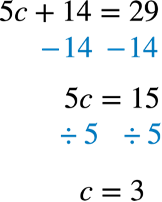
- For example: 5c + 14 = 29 (the numbers chosen make a concrete approach less practical).
- Encourage them to see if they can solve them without using concrete or pictorial models.
- Observe the groups as they work on the equation. If needed, suggest drawing a box around the variable term (as was done in the Before) and figuring out the value of the box first.
After:
- Have the class share their strategies for solving each equation. For the example above:
- 29 – 14 = 15, so the 5c must equal 15. So we divided 15 by 5 to get c = 3
- Record the steps to model the process symbolically for one of the equations:
- Consolidate the learning of this process by identifying the key concepts. The thinking through these steps is the same as they experienced when using the balance scale model.
- To solve the equation, we needed to isolate the variable, i.e., get the variable on its own.
- To keep the equation balanced, whatever operation we did to one side, we needed to do to the other.
- Notice that the operation on both sides each time was the inverse operation.
- When we had + 14 we had to subtract 14.
- When we had 5n, we needed to divide by 5.
- Explain to students that using inverse operations is a helpful strategy, but not the only strategy. Most strategies still involve the same kind of algebraic thinking, even if they are carried about using different approaches.
- In addition to having students practice solving more equations, you could have them build their own equations and have a classmate solve them.
- Pick a letter to represent the variable.
- Give the variable a value, e.g., w = 6
- Choose a coefficient, e.g., 3w
- Choose a constant, e.g., 3w + 7
- Evaluate their expression for the value they chose for the variable, e.g., 3 x 6 + 7 = 25
- The equation is 3w + 7 = 25
Focus: Solving other forms of equations (you may wish to omit this if you’re satisfied focusing on just solving ax + b = c forms of equations).
Before:
- Do a Which One Doesn’t Belong routine
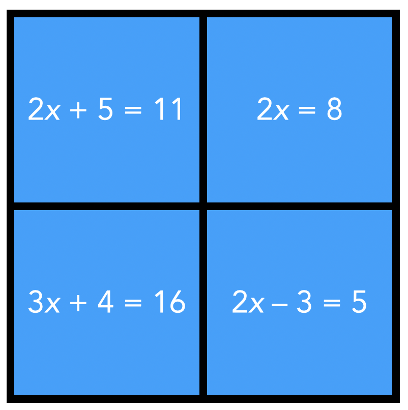
- Have students share their ideas. Students may describe several different reasons for each. Here are some sample answers:
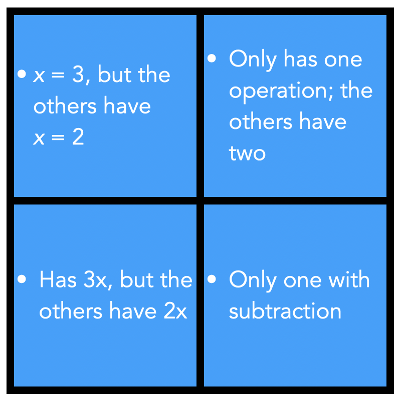
- If not all of the equations were solved, have students solve each equation using whichever strategy or representation makes sense for them. They may struggle to solve the bottom right equation algebraically. That will be part of the focus of today’s lesson.
During:
- Have the class work in small groups.
- Present 3 equations to the class that use similar numbers but have different structures. For example:

- Ask them to solve the equations, and to reflect on how the solution was process compared between the equations.
- As with the previous day’s lesson, if needed you may suggest that they put a box around the variable term and figure out the value of the box.
After:
- Have the class guide you through solving the equations. Rather than do one equation at a time, go through each step for all equations so that the similarities and differences can be noted.
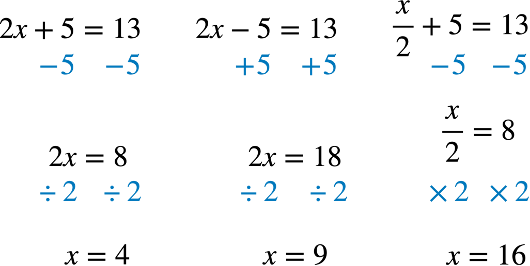
- The second equation was different because of subtraction. So we needed to use addition as the inverse operation.
- The third equation was different because of division. So we needed to divide as the inverse operation.
- Provide students some additional equations of each type to solve for practice. They may choose alternative strategies if they so choose.
Focus: Connecting solving equations to linear relations. This lesson would be optional, but it is always meaningful to make mathematical connections between concepts.
Before:
- To activate their prior knowledge about linear relations, have students match expressions with linear patterns. For example, match these:

- Some ideas that may emerge include:
- The rate of change tells us the coefficient of the variable. For example, 3n indicates which patterns increase by 3 each time.
- We can figure out the constant by determining which number comes before in each pattern, because then the variable would have a value of 0.
During:
- Select one of the matched patterns from the For example: 2, 5, 8, 11, …, 3n – 1
- Remind students of the terminology. In this pattern the first term is 2, the second term is 5, and so on.
- Have students work in pairs or small groups.
- Ask them to figure out which term in this pattern is 62.
- If any groups are finished before others, encourage them to see if they can use more than one strategy. They may also try a problem like, “Do any of the patterns from the Before have the number 50 in it? If so, which pattern(s), and which term?”
After:
- Have some groups share their answer and strategy. Begin with strategies that do not involve using an equation first. For example:
- We kept adding 3 until we reached 62. It ended up being the 21st term.
- The 4th term is 11, so we had to add 51 more. That’s adding three 17 more times, so it would be the 21st term.
- We used an equation, 3n – 1 = 62, and solved for We got n = 21.
- Apply the using of an equation strategy to solve a related problem. For example, which term in –1, 3, 7, 11, …, 4n – 3 is 61?
- Ask the students to note how the variable means something a bit different between an expression and an equation.
- In an expression, a variable can be any value.
- In an equation, a variable represents a specific, but unknown, value.
- Have students explore similar problems, but include decreasing patterns and/or visual patterns. You may also wish them to explore contextual problems or finding the coordinates of a distant point on a graph.